[译]Visual Leak Detector-增强的Visual C ++内存泄漏检测
By robot-v1.0
本文链接 https://www.kyfws.com/applications/visual-leak-detector-enhanced-memory-leak-detectio-zh/
版权声明 本博客所有文章除特别声明外,均采用 BY-NC-SA 许可协议。转载请注明出处!
- 26 分钟阅读 - 12606 个词 阅读量 0[译]Visual Leak Detector-增强的Visual C ++内存泄漏检测
原文地址:https://www.codeproject.com/Articles/9815/Visual-Leak-Detector-Enhanced-Memory-Leak-Detectio
原文作者:Dan Moulding
译文由本站 robot-v1.0 翻译
前言
A memory leak detector for Visual C++ packaged in an easy to use library!
一个易于使用的库中包装的Visual C ++内存泄漏检测器!
- 下载Visual Leak Detector 1.0-476 Kb(Download Visual Leak Detector 1.0 - 476 Kb)
- 下载Visual Leak Detector的1.9d beta版(包括源代码)-728 Kb(Download the 1.9d beta version of Visual Leak Detector (includes source) - 728 Kb)
- 下载源代码(1.0版)-50.3 Kb(Download the source code (version 1.0) - 50.3 Kb)
目录(Table of Contents)
- 介绍(Introduction)
- ** 什么是新的?(What’s New?) **
- 使用视觉检漏仪(Using Visual Leak Detector)
- 制作内存泄漏检测器(Making a Memory Leak Detector)
- 源代码的关键部分(Key Parts of the Source Code)
- 已知错误和限制(Known Bugs and Restrictions)
- 学分(Credits)
- 参考文献(References)
- 执照(License)
- 历史(History)
介绍(Introduction)
Visual C ++提供了内置的内存泄漏检测功能,但其功能充其量是最少的.此内存泄漏检测器是作为Visual C ++随附的内置内存泄漏检测器的免费替代产品而创建的.这是视觉泄漏检测器的一些功能,内置检测器中没有这些功能:(Visual C++ provides built-in memory leak detection, but its capabilities are minimal at best. This memory leak detector was created as a free alternative to the built-in memory leak detector provided with Visual C++. Here are some of Visual Leak Detector’s features, none of which exist in the built-in detector:)
-
为每个泄漏的块提供完整的堆栈跟踪,包括可用的源文件和行号信息.(Provides a complete stack trace for each leaked block, including source file and line number information when available.)
-
提供泄漏块的完整数据转储(十六进制和ASCII).(Provides complete data dumps (in hex and ASCII) of leaked blocks.)
-
内存泄漏报告中的可定制详细程度.(Customizable level of detail in the memory leak report.) Visual C ++的其他售后检漏仪已经可用.但是大多数真正流行的工具,例如Purify和BoundsChecker,都非常昂贵.存在一些免费的替代方案,但它们通常过于侵入,限制或不可靠.与许多其他免费替代产品相比,Visual Leak Detector具有一些主要优点:(Other after-market leak detectors for Visual C++ are already available. But most of the really popular ones, like Purify and BoundsChecker, are very expensive. A few free alternatives exist, but they’re often too intrusive, restrictive, or unreliable. Here are some key advantages that Visual Leak Detector has over many other free alternatives:)
-
Visual Leak Detector干净地打包为易于使用的库.您无需编译其源代码即可使用它.您只需要对自己的源代码进行少量添加即可将其与程序集成.(Visual Leak Detector is cleanly packaged as an easy-to-use library. You don’t need to compile its source code to use it. And you only need to make minor additions to your own source code to integrate it with your program.)
-
除了为堆栈跟踪提供源文件,行号和函数名外,Visual Leak Detector还提供数据转储.(In addition to providing stack traces with source files, line numbers, and function names, Visual Leak Detector also provides data dumps.)
-
它适用于C ++和C程序(与两者兼容(It works with both C++ and C programs (compatible with both)
new/(/)delete和(and)malloc/(/)free).().) -
包含了该库的完整源代码,并且有充分的文档记录,因此可以轻松地对其进行自定义以满足您的需求.(The full source code to the library is included and it is well documented, so it is easy to customize it to suit your needs.) 现"视觉检漏器"为(Visual Leak Detector is) 领有牌照(licensed) 作为Windows开发者社区的免费服务.(free of charge as a service to the Windows developer community.)
什么是新的?(What’s New?)
**2006年11月14日:(14 November 2006:)**一个新的beta版本已经发布.此版本修复了一些错误,最显着的是1.9c beta中发现的死锁错误和一些失败的断言错误.(A new beta version has been posted. This version fixes a few bugs, most notably a deadlock bug and a couple of failed assertion bugs that were identified in the 1.9c beta.)
请注意,测试版与1.0版没有相同的限制.而1.0只能检测到由(Note that the beta version does not have the same limitations of the 1.0 version. Whereas 1.0 can only detect leaks resulting from) new 要么(or) malloc ,测试版可以检测到许多不同类型的泄漏.(, the beta can detect many different classes of leaks.)
另请注意,以下文章介绍了1.0版本的内部工作原理.由于Beta版本在下一个正式版本之前可能会发生重大变化,因此在正式版本完成之前,本文不会进行更新以反映Beta版本的设计.(Please also note that the article below describes the inner workings of the 1.0 version. Because the beta version might change significantly before the next official release, the article will not be updated to reflect the design of the beta version until the official release is complete.)
使用视觉检漏仪(Using Visual Leak Detector)
本节简要介绍了使用Visual Leak Detector(VLD)的基础知识.有关配置选项,运行时API的更深入讨论以及更高级的使用场景(例如,将VLD与DLL一起使用)的讨论,请参阅可下载的Zip文件中包含的完整文档.(This section briefly describes the basics of using Visual Leak Detector (VLD). For a more in-depth discussion of the configuration options, runtime APIs, and a discussion of the more advanced usage scenarios (such as using VLD with DLLs), please see the full documentation included in the downloadable Zip files.)
要在项目中使用VLD,请按照以下简单步骤操作:(To use VLD with your project, follow these simple steps:)
- 复制VLD库((Copy the VLD library ()** .lib(**.lib*)*)文件添加到Visual C ++安装的"(*) files to your Visual C++ installation’s “*)*LIB(*lib*)*“子目录.(*” subdirectory.*)
- 复制VLD头文件((Copy the VLD header files ()vld.h(vld.h)和(and)vldapi.h(vldapi.h))到您的Visual C ++安装的”() to your Visual C++ installation’s “)包括(include)“子目录.(” subdirectory.)
- 在包含程序主入口点的源文件中,包括(In the source file containing your program’s main entry point, include the)vld.h(vld.h)头文件.最好(但并非绝对必要)在其他任何头文件之前添加此头文件,除了(header file. It’s best, but not absolutely required, to include this header before any other header files, except for)stdafx.h(stdafx.h).如果源文件包含(. If the source file, include)stdafx.h(stdafx.h), 然后(, then)*vld.h(vld.h)*应该包括在它之后.(should be included after it.)
- 如果您运行的是Windows 2000或更早版本,则需要复制(If you are running Windows 2000 or earlier, then you will need to copy)*dbghelp.dll(dbghelp.dll)*到要调试的可执行文件所在的目录.(to the directory where the executable being debugged resides.)
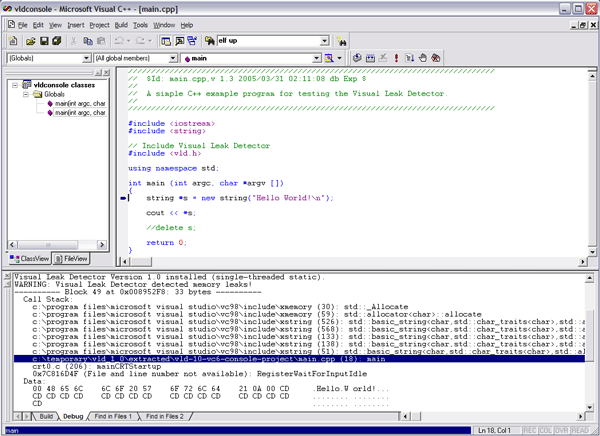
- 生成项目的调试版本.(Build the debug version of your project.) 只要在Visual C ++调试器下运行调试版本,VLD就会检测程序中的内存泄漏.程序退出时,所有检测到的内存泄漏的报告将显示在调试器的输出窗口中.双击内存泄漏报告中源文件的行号,将带您进入编辑器窗口中的该文件和行,从而可以轻松浏览代码路径,从而导致导致内存泄漏的分配.(VLD will detect memory leaks in your program whenever you run the debug version under the Visual C++ debugger. A report of all the memory leaks detected will be displayed in the debugger’s output window when your program exits. Double-clicking on a source file’s line number in the memory leak report will take you to that file and line in the editor window, allowing easy navigation of the code path leading up to the allocation that resulted in a memory leak.)
**注意:(Note:)**当您生成程序的发行版本时,VLD将不会链接到可执行文件中.所以安全离开(When you build release versions of your program, VLD will not be linked into the executable. So it is safe to leave)*vld.h(vld.h)*进行发行版本构建时,源文件中包含这些文件.这样做不会导致任何性能下降或任何其他不希望的开销.(included in your source files when doing release builds. Doing so will not result in any performance degradation or any other undesirable overhead.)
制作内存泄漏检测器(Making a Memory Leak Detector)
Visual Leak Detector的目标是为Visual C ++内置的内存泄漏检测器构建更好的替代品.考虑到这一点,我着手使用内置检测器使用的相同方法,即CRT调试堆.但是这个新的检测器将提供增强功能-主要是完整的堆栈跟踪,可以(The goal of Visual Leak Detector was to build a better replacement for the memory leak detector built-in to Visual C++. With that in mind, I set out to use the same method used by the built-in detector, namely the CRT Debug Heap. But this new detector would provide enhancements – primarily full stack traces, which can be)*非常(extremely)*对于发现和修复泄漏很有帮助.(helpful for finding and fixing leaks.)
内置探测器(The Built-In Detector)
内置检测器确实非常简单.当程序退出时,CRT将在运行一堆清理代码后(The built-in detector is pretty simple really. When a program is exiting, the CRT runs a bunch of cleanup code after) main 返回.如果启用了内置检测器,则它将作为清除过程的一部分运行内存泄漏检查.内存泄漏检查仅查看调试堆:如果在调试堆上仍分配了任何用户块,则它们一定是内存泄漏.的调试版本(returns. If the built-in detector is enabled, then it runs a memory leak check as part of the cleanup procedure. The memory leak check simply looks at the debug heap: if there are any user blocks still allocated on the debug heap, then they must be memory leaks. The debug version of) malloc 在分配块时,将已分配每个块的文件和行号存储在块的标题中.当内置检测器识别出内存泄漏时,它仅在块头内部进行对等即可获取文件和行号.然后,它将信息报告给显示该信息的调试器.(stores the file and line number that allocated each block in the block’s header at the time it is allocated. When the built-in detector identifies a memory leak, it simply peers inside the block header to get the file and line number. It then reports that information to the debugger where it is displayed.)
请注意,内置检测器无需进行任何分配或释放监视就可以检测泄漏.它只是在进程终止之前获取堆的快照,并根据该快照确定是否存在泄漏.堆的快照仅告诉我们是否存在(Note that the built-in detector detects leaks without doing any monitoring of allocations or frees. It simply takes a snapshot of the heap just before the process terminates and determines if there are any leaks based on that snapshot. A snapshot of the heap only tells us if there)*是(are)*泄漏;它没有告诉我们(leaks; it does not tell us)*怎么样(how)*他们被泄露了.显然,要确定"如何”,我们还需要获得堆栈跟踪.但是要获得堆栈跟踪,我们需要能够在运行时实时监控每个分配.这就是将我们的检漏仪与内置检漏仪区分开的地方.(they were leaked. Clearly, to determine the “how” we also need to obtain a stack trace. But to obtain a stack trace, we need to be able to monitor every allocation on-the-fly at runtime. This is what will distinguish our leak detector from the built-in one.)
分配挂钩(Allocation Hooking)
对我们来说幸运的是,Microsoft提供了一种简单的方法来监视调试堆中的每个分配:分配挂钩.分配挂钩只是用户提供的回调函数,将在从调试堆进行每个分配之前调用.微软提供了一个功能,(Luckily for us, Microsoft has provided an easy way to monitor every allocation made from the debug heap: allocation hooks. An allocation hook is simply a user-supplied callback function that will be called just before each allocation is made from the debug heap. Microsoft has provided a function,) _CrtSetAllocHook ,它向调试堆注册了分配挂钩函数.当调试堆调用分配钩子时,传递的参数之一是唯一标识每个分配的ID号-基本上是分配的每个内存块的序列号.存储块标题中没有足够的空间来直接在其中记录任何信息,但是我们可以使用此唯一ID号作为将每个块映射到我们要记录的任何数据的键.(, which registers the allocation hook function with the debug heap. When the debug heap calls the allocation hook, one of the arguments passed is an ID number that uniquely identifies each allocation – it’s basically a serial number for each memory block allocated. There’s not enough room in the memory block header for us to record any information directly in it, but we can use this unique ID number as a key to map each block to any data that we want to record.)
走栈(Walking the Stack)
现在,我们有了一种在每次分配块时都会收到通知的方法,以及一种唯一标识每个分配的方法,剩下要做的就是在每次分配发生时记录调用堆栈.可以想象,我们可以尝试使用内联汇编自己展开堆栈.但是堆栈框架可以以不同的方式组织,具体取决于编译器的优化和调用约定,因此以这种方式进行操作可能会变得很复杂.微软再次为我们提供了帮助我们的工具.这次,我们可以迭代调用该函数以逐帧遍历堆栈.该功能是(Now that we have a way to be notified every time a block is allocated, as well as a way to uniquely identify each allocation, all that’s left to do is to record the call stack each time an allocation occurs. We could conceivably attempt to unwind the stack ourselves using inline assembly. But stack frames can be organized in different ways, depending on compiler optimizations and calling conventions, so it could become complicated to do it that way. Once again, Microsoft has provided us with a tool to help us out. This time it is a function that we can call iteratively to walk the stack, frame by frame. That function is) StackWalk64 .它是调试帮助库((. It is part of the Debug Help Library ()dbghelp.dll(dbghelp.dll)).可以说,只要我们提供建立初始"参考框架"所需的信息,它就可以从此处检查堆栈,并为我们可靠地展开.每一次(). As long as we provide it with the information that it needs to establish a starting “frame of reference”, so to speak, it can examine our stack from there and reliably unwind it for us. Each time) StackWalk64 被称为,它会给(is called, it gives back a) STACKFRAME64 可以重新用作下一次调用的输入的结构(structure that can be reused as input for the next call to) StackWalk64 .可以以此方式重复调用它,直到到达堆栈末尾为止.(. It can be repeatedly called this way until the end of the stack is reached.)
初始化内存泄漏检测器(Initializing the Memory Leak Detector)
现在,我们有了更好的内存泄漏检测器的开始.我们可以监视每个分配,并且对于每个监视的分配,我们可以获取并记录堆栈跟踪.剩下的唯一挑战是确保在程序开始执行后立即在调试堆中注册分配挂钩函数.通过创建C ++类对象的全局实例,可以非常简单地解决此问题.初始化程序后,构造函数将运行.从构造函数中,我们可以调用(We now have the beginnings of a better memory leak detector. We can monitor every allocation, and for each allocation monitored, we can obtain and record a stack trace. The only challenge that remains is to ensure that the allocation hook function is registered with the debug heap as soon as the program starts executing. This can be very simply solved by creating a global instance of a C++ class object. The constructor will run when the program is initialized. From the constructor, we can call) _CrtSetAllocHook 注册我们的分配挂钩函数.但是等等,如果我们要调试的程序已经有了怎么办(to register our allocation hook function. But wait, what if the program we are debugging already has)其他(other)分配内存的全局C ++类对象?我们如何确保将首先调用构造函数,并确保在构造任何其他全局对象之前安装分配挂钩函数?不幸的是,C ++规范没有阐明任何规则来确定构造全局对象的顺序.因此,我们不能绝对保证将首先调用我们的构造函数.但是我们可以非常接近地保证它.我们可以利用特定于编译器的预处理器指令,该指令明确告诉编译器确保尽快构造全局变量:(global C++ class objects that allocate memory? How can we ensure that our constructor will be called first, and that our allocation hook function will be installed before any other global objects are constructed? Unfortunately, the C++ specification does not spell out any rules for deciding in which order to construct global objects. So there are no absolute guarantees that our constructor will be called first. But we can come very close to guaranteeing it. We can leverage a compiler-specific preprocessor directive that explicitly tells the compiler to ensure that our global variable is constructed as soon as possible:) #pragma init_seg (compiler) .该指令告诉编译器将全局对象放在"编译器"初始化段中.此段中的对象是第一个构造的对象.接下来,构造"库"段中的对象,最后构造"用户"段中的对象. “用户"段是全局对象的默认段.一般而言,不应将任何普通用户对象放在"编译器"段中,因此这提供了一定的确定性,即可以在任何用户对象之前构造全局对象.(. This directive tells the compiler to place our global object in the “compiler” initialization segment. Objects in this segment are the first to be constructed. Next, objects in the “library” segment are constructed, and objects in the “user” segment are constructed last. The “user” segment is the default segment for global objects. Generally speaking, no normal user objects should ever be placed in the “compiler” segment, so this provides a reasonable amount of certainty that our global object will be constructed before any user objects.)
检测内存泄漏(Detecting Memory Leaks)
因为全局对象以相反的顺序销毁,所以我们的全局对象将在所有用户对象之后销毁.然后,我们可以像内置检测器一样检查堆.如果我们在堆上找到一个尚未释放的块,则可能是泄漏,我们可以使用分配挂钩函数记录的唯一ID号来查找其调用堆栈. STL映射在这里可以很好地用于将ID号映射到调用堆栈.我没有使用STL映射,因为我希望我的库与Visual C ++的新旧版本兼容.旧版本的STL与新版本不兼容,因此我无法使用STL组件.但是,好消息是,这使我有机会创建一个概念上类似于STL映射的数据结构,但可以对我的内存泄漏检测器进行特定的优化.(Because global objects are destroyed in the inverse order they are constructed, our global object will be destroyed after any user objects. We can then examine the heap, just like the built-in detector does. If we find a block on the heap that has not been freed, it is a leak and we can look up its call stack using the unique ID number recorded by our allocation hook function. An STL map would work fine here for mapping the ID number to the call stacks. I didn’t use an STL map because I wanted my library to be compatible with both new and old versions of Visual C++. The STL from older versions is incompatible with the newer versions, so I couldn’t use STL components. But the good news is that this gave me the opportunity to create a data structure similar in concept to the STL map, but with specific optimizations for use with my memory leak detector.)
您还记得内置的泄漏检测器会在内存块内部对等以获取文件名和分配该块的行号吗?好吧,我们的调用栈只有一堆程序地址.将所有这些十六进制数字转储到调试器中没有多大用处.为了使这些地址更有意义,我们需要将其转换为人类可读的信息:文件和行号(以及函数名). Microsoft再次提供了可帮助我们完成工作的工具:符号处理程序API.喜欢(Do you remember that the built-in leak detector peers inside the memory block to get the name of the file and the line number where the block was allocated? Well, all we have for our call stack is a bunch of program addresses. Dumping all those hex numbers to the debugger wouldn’t be of much use. To make those addresses more meaningful, we need to translate them to human readable information: files and line numbers (and function names too). Once again, Microsoft comes through with the tools that will help us do our job: the symbol handler APIs. Like) StackWalk64 ,它们也恰好是"调试帮助库"的一部分.我不会在这里详细介绍它们,因为它们很多,而且它们的使用非常简单.他们不需要像(, they also happen to be part of the Debug Help Library. I won’t dwell on them in detail here, because there are a lot of them and they’re pretty simple to use. They don’t require as much ingenuity to use as) StackWalk64 做.我们可以使用两个符号处理程序API来获取所需的文件名,行号和函数名.恰当地命名(does. We can use two of the symbol handler APIs to get the filenames, line numbers, and function names that we want. The aptly named) SymGetLineFromAddr64 将地址转换为源文件名和行号.它的姊妹API(translates addresses into source filenames and line numbers. Its sister API,) SymFromAddr 将地址转换为符号名称.对于我们拥有的程序地址,相应的符号名称将是包含该程序地址的函数的名称.(translates addresses into symbol names. For program addresses, which are what we have, the corresponding symbol name will be the name of the function containing that program address.)
源代码的关键部分(Key Parts of the Source Code)
如果您对以上部分感到厌倦并跳过,请在此处进行总结.简而言之,此内存泄漏检测器的工作方式如下:(In case you got bored with the above section and skipped ahead, I’ll summarize it here. In a nutshell, this memory leak detector works like this:)
- 全局对象将自动构建.这是第一个构造的对象.构造函数注册我们的分配挂钩函数.(A global object is automatically constructed. It is the first object constructed. The constructor registers our allocation hook function.)
- 每个分配最终都会调用我们的分配挂钩函数.分配挂钩函数获取并记录每个分配的调用堆栈.呼叫堆栈信息记录在专门的类似于STL的映射中.(Every allocation eventually calls our allocation hook function. The allocation hook function obtains and records the call stack for each allocation. The call stack information is recorded in a specialized STL-like map.)
- 程序终止时,全局对象是最后销毁的对象.它检查堆并识别泄漏.在映射中查找泄漏的块,并将其与相应的调用堆栈匹配.结果数据将发送到调试器以显示.(When the program terminates, the global object is the last object destroyed. It examines the heap and identifies leaks. Leaked blocks are looked up in the map and matched with their corresponding call stack. The resulting data is sent to the debugger to be displayed.)
步骤1:注册分配挂钩(Step 1: Registering the Allocation Hook)
这里是(Here is the) VisualLeakDetector 类的构造函数.请注意(class constructor. Note the call to) _CrtSetAllocHook .这是我们的回调函数,(. This is where our callback function,) allochook ,已在调试堆中注册.致电(, is registered with the debug heap. The call to) linkdebughelplibrary 使用调试帮助库执行明确的动态链接((performs an explicit dynamic link with the Debug Help Library ()dbghelp.dll(dbghelp.dll)).因为VLD本身是一个库,所以通过导入库隐式链接到Debug Help Library.(). Because VLD is itself a library, implicitly linking with the Debug Help Library through the import library)*dbghelp.lib(dbghelp.lib)*不受欢迎的这会使VLD库依赖于(is undesirable; it would make the VLD library dependent on)*dbghelp.lib(dbghelp.lib)*在链接时.(at link-time.)*dbghelp.lib(dbghelp.lib)*不会在许多Windows计算机上出现,并且无法重新分发,因此我们需要在运行时与DLL链接以绕过导入库.这里还有很多其他内容,但是其中大多数与VLD支持的自定义配置选项有关.(will not be present on many Windows computers and it’s not redistributable, so we need to link with the DLL at runtime in order to bypass the import library. There is a lot of other stuff going on in here as well, but most of it has to do with custom configuration options that VLD supports.)
// Constructor - Dynamically links with the Debug Help Library and installs the
//   allocation hook function so that the C runtime's debug heap manager will
//   call the hook function for every heap request.
//
VisualLeakDetector::VisualLeakDetector ()
{
    // Initialize private data.
    m_mallocmap    = new BlockMap;
    m_process      = GetCurrentProcess();
    m_selftestfile = __FILE__;
    m_status       = 0x0;
    m_thread       = GetCurrentThread();
    m_tlsindex     = TlsAlloc();

    if (_VLD_configflags & VLD_CONFIG_SELF_TEST) {
        // Self-test mode has been enabled.
        // Intentionally leak a small amount of
        // memory so that memory leak self-checking can be verified.
        strncpy(new char [21], "Memory Leak Self-Test", 21);
        m_selftestline = __LINE__;
    }

    if (m_tlsindex == TLS_OUT_OF_INDEXES) {
        report("ERROR: Visual Leak Detector:"
               " Couldn't allocate thread local storage.\n");
    }
    else if (linkdebughelplibrary()) {
        // Register our allocation hook function with the debug heap.
        m_poldhook = _CrtSetAllocHook(allochook);
        report("Visual Leak Detector "
               "Version "VLD_VERSION" installed ("VLD_LIBTYPE").\n");
        reportconfig();
        if (_VLD_configflags & VLD_CONFIG_START_DISABLED) {
            // Memory leak detection will initially be disabled.
            m_status |= VLD_STATUS_NEVER_ENABLED;
        }

        m_status |= VLD_STATUS_INSTALLED;
        return;
    }

    report("Visual Leak Detector is NOT installed!\n");
}
步骤2:走栈(Step 2: Walking the Stack)
这是负责获取调用堆栈的函数.这也许是整个程序中最棘手的部分.设置第一个呼叫(Here is the function responsible for obtaining call stacks. This is perhaps the trickiest part of the entire program. Setting up for the first call to) StackWalk64 就是棘手的地方.要开始堆栈跟踪,(is where the tricky bit is. To start the stack trace,) StackWalk64 需要确切地知道要在堆栈中的哪个位置开始步行.它从不假设我们要从当前堆栈帧开始跟踪.这要求我们为其提供当前帧的地址以及当前程序的地址.我看过其他示例,这些示例试图通过调用来获取此信息(needs to know exactly where on the stack to begin walking. It never assumes that we want to start tracing from the current stack frame. This requires that we provide it with the address of the current frame, as well as the current program address. I’ve seen other examples that attempt to get this information by calling) GetThreadContext 检索当前线程的上下文,该上下文将包含两个必需的地址.但是,正如其文档明确指出的那样,(to retrieve the current thread’s context, which would contain both of the required addresses. But, as its documentation clearly states,) GetThreadContext 不能依靠它来获取正在运行的线程的有效信息.根据定义,这意味着(can’t be relied upon to get valid information for a running thread. By definition, this means that) GetThreadContext 无法获得当前线程的有效上下文.更好的方法是直接获取所需的地址,而唯一的方法是内联汇编.(can’t get a valid context for the current thread. A better approach is to get the required addresses directly, and the only way to do that is with inline assembly.)
获取当前帧的地址很容易:它存储在CPU寄存器中((Obtaining the address of the current frame is easy: it’s stored in a CPU register () EBP ),我们可以直接从中读取.程序地址很难获取.虽然有一个CPU寄存器(() that we can directly read it from. The program address is a little harder to obtain. Though there is a CPU register () EIP )(始终包含当前程序地址),在Intel x86 CPU上,软件无法读取.但是我们可以通过调用另一个函数并从该函数内部获取返回地址,以一种绕行方式获得相同的地址.返回地址与调用该函数的程序地址相同.为此,我创建了一个单独的函数,() that always contains the current program address, on Intel x86 CPUs, it can’t be read by software. But we can get the same address in a round-about way, by calling another function and from within that function obtaining the return address. The return address is the same as the program address that called the function. For this, I’ve created a separate function,) getprogramcounterx86x64 .由于我们已经在进行内联汇编,因此可以在汇编中编写一个简单的函数调用,而不是编写另一个C ++函数,但是为了使其更容易理解,我在可能的地方使用了C ++.(. Since we’re already doing inline assembly, we could write a simple function call in assembly, instead of writing another C++ function, but to keep it easier to understand, I’ve used C++ wherever it’s possible to do so.)
在以下代码中,(In the following code,) pStackWalk64 ,(,) pSymFunctionTableAccess64 和(and) pSymGetModuleBase64 都是由导出的函数的指针(are all pointers to the functions exported by)dbghelp.dll(dbghelp.dll).(.)
// getstacktrace - Traces the stack, starting from this function, as far
//   back as possible.
//
//  - callstack (OUT): Pointer to an empty CallStack to be populated with
//    entries from the stack trace.
//
//  Return Value:
//
//    None.
//
void VisualLeakDetector::getstacktrace (CallStack *callstack)
{
    DWORD        architecture;
    CONTEXT      context;
    unsigned int count = 0;
    STACKFRAME64 frame;
    DWORD_PTR    framepointer;
    DWORD_PTR    programcounter;

    // Get the required values for initialization of the STACKFRAME64 structure
    // to be passed to StackWalk64(). Required fields are AddrPC and AddrFrame.
#if defined(_M_IX86) || defined(_M_X64)
    architecture = X86X64ARCHITECTURE;
    programcounter = getprogramcounterx86x64();
    __asm mov [framepointer], BPREG // Get the frame pointer (aka base pointer)
#else
// If you want to retarget Visual Leak Detector to another processor
// architecture then you'll need to provide architecture-specific code to
// retrieve the current frame pointer and program counter in order to initialize
// the STACKFRAME64 structure below.
#error "Visual Leak Detector is not supported on this architecture."
#endif // defined(_M_IX86) || defined(_M_X64)

    // Initialize the STACKFRAME64 structure.
    memset(&frame, 0x0, sizeof(frame));
    frame.AddrPC.Offset    = programcounter;
    frame.AddrPC.Mode      = AddrModeFlat;
    frame.AddrFrame.Offset = framepointer;
    frame.AddrFrame.Mode   = AddrModeFlat;

    // Walk the stack.
    while (count < _VLD_maxtraceframes) {
        count++;
        if (!pStackWalk64(architecture, m_process, m_thread,
             &frame, &context, NULL, pSymFunctionTableAccess64,
             pSymGetModuleBase64, NULL)) {
            // Couldn't trace back through any more frames.
            break;
        }
        if (frame.AddrFrame.Offset == 0) {
            // End of stack.
            break;
        }

        // Push this frame's program counter onto the provided CallStack.
        callstack->push_back((DWORD_PTR)frame.AddrPC.Offset);
    }
}
这是检索(And here is the function that retrieves the) EIP 寄存器.同样,这必须作为单独的函数调用完成,因为软件无法直接读取(register. Again, this has to be done as a separate function call because there is no way for the software to directly read the) EIP 寄存器.但是,可以通过进行函数调用,然后从被调用函数内部获取返回地址来获得相同的值.返回地址是进行函数调用的程序地址,并且在进行函数调用时将其压入堆栈.我们通过从堆栈中复制得到它.(register. But the same value can be obtained by making a function call, and then from within the called function getting the return address. The return address is the program address that made the function call, and it is pushed onto the stack when the function call is made. We get it by copying it from the stack.)
// getprogramcounterx86x64 - Helper function that retrieves the program counter
//   for getstacktrace() on Intel x86 or x64 architectures.
//
//  Note: Inlining of this function must be disabled. The whole purpose of this
//    function's existence depends upon it being a *called* function.
//
//  Return Value:
//
//    Returns the caller's program address.
//
#if defined(_M_IX86) || defined(_M_X64)
#pragma auto_inline(off)
DWORD_PTR VisualLeakDetector::getprogramcounterx86x64 ()
{
    DWORD_PTR programcounter;

    // Get the return address out of the current stack frame
    __asm mov AXREG, <BPREG + SIZEOFPTR>
    // Put the return address into the variable we'll return
    __asm mov [programcounter], AXREG

    return programcounter;
}
#pragma auto_inline(on)
#endif // defined(_M_IX86) || defined(_M_X64)
步骤3:生成更好的内存泄漏报告(Step 3: Generating a Better Memory Leak Report)
最后,这是将在堆栈中移动时获得的程序地址转换为有用的符号名称的函数.请注意,只有在检测到内存泄漏时才运行地址到符号的转换代码.这样可以避免在程序运行时即时进行符号查找,这会增加相当大的额外开销.更不用说存储(大)符号名称以供以后在可以存储(小)地址时检索时没有意义.(Finally, here is the function that converts the program addresses obtained while walking the stack into useful symbol names. Note that the address-to-symbol conversion code is only run if memory leaks are detected. This avoids having to do symbol lookups on-the-fly while the program is running, which would add considerable additional overhead. Not to mention that it just doesn’t make sense to store (large) symbol names for later retrieval when you can store (small) addresses instead.)
CRT没有公开任何书面方法来访问其分配的内存块的内部链接列表.内置检测器使用此链表获取堆的"快照"以确定是否有任何内存泄漏.我想出了一个非常简单的技巧来访问列表.每当分配新的内存块时,它都会恰好放在链接列表的开头.因此,要获得指向列表开头的指针,我只需分配一个临时内存块.该块的地址可以转换为包含该地址的地址(The CRT doesn’t expose any documented method for gaining access to its internal linked-list of allocated memory blocks. This linked list is what is used by the built-in detector for taking a “snapshot” of the heap to determine if there are any memory leaks. I’ve come up with a very simple trick to gain access to the list. Any time a new memory block is allocated, it happens to be placed at the beginning of the linked-list. So, to get a pointer to the head of the list, I just allocate a temporary memory block. That block’s address can be converted to the address of the containing) _CrtMemBlockHeader 结构,现在我有一个指向链表开头的指针.(structure and now I have a pointer to the beginning of the linked list.)
在以下代码中,(In the following code,) pSymSetOptions ,(,) pSymInitialize ,(,) pSymGetLineFromAddr64 和(, and) pSymFromAddr 都是由导出的函数的指针(are all pointers to the functions exported by)dbghelp.dll(dbghelp.dll).的(. The) report 函数只是一个自定义包装(function is just a custom wrapper around) OutputDebugString 它将消息发送到调试器以显示在调试器的输出窗口中.(which sends messages to the debugger for display in the debugger’s output window.)
此功能相当长.为了减少混乱,我删除了所有不必要的琐碎部分.要完整地查看此功能,请下载源ZIP文件.(This function is quite long. To cut down on clutter, I’ve removed all of the uninteresting and trivial parts. To see this function in its entirety, please download the source ZIP file.)
// reportleaks - Generates a memory leak report when the program terminates if
//   leaks were detected. The report is displayed in the debug output window.
//
//  Return Value:
//
//    None.
//
void VisualLeakDetector::reportleaks ()
{

    ...

    // Initialize the symbol handler. We use it for obtaining source file/line
    // number information and function names for the memory leak report.
    symbolpath = buildsymbolsearchpath();
    pSymSetOptions(SYMOPT_LOAD_LINES | SYMOPT_DEFERRED_LOADS | SYMOPT_UNDNAME);
    if (!pSymInitialize(m_process, symbolpath, TRUE)) {
        report("WARNING: Visual Leak Detector: The symbol handler"
               " failed to initialize (error=%lu).\n"
               "    Stack traces will probably not be available"
               " for leaked blocks.\n", GetLastError());
    }

    ...

#ifdef _MT
    _mlock(_HEAP_LOCK);
#endif // _MT
    pheap = new char;
    pheader = pHdr(pheap)->pBlockHeaderNext;
    delete pheap;
    while (pheader) {

        ...

        callstack = m_mallocmap->find(pheader->lRequest);
        if (callstack) {

            ...

            // Iterate through each frame in the call stack.
            for (frame = 0; frame < callstack->size(); frame++) {
                // Try to get the source file and line number associated with
                // this program counter address.
                if (pSymGetLineFromAddr64(m_process,
                   (*callstack)[frame], &displacement, &sourceinfo)) {

                    ...

                }

                // Try to get the name of the function containing this program
                // counter address.
                if (pSymFromAddr(m_process, (*callstack)[frame],
                    &displacement64, pfunctioninfo)) {
                    functionname = pfunctioninfo->Name;
                }
                else {
                    functionname = "(Function name unavailable)";
                }

                ...

            }

            ...

        }
        pheader = pheader->pBlockHeaderNext;
    }
#ifdef _MT
    _munlock(_HEAP_LOCK);
#endif // _MT

    ...

}
已知错误和限制(Known Bugs and Restrictions)
最新版本中目前没有已知的错误,但是有一些已知的限制:(There are currently no known bugs in the latest release, but there are some known restrictions:)
- VLD不会检测到COM泄漏,进程外资源泄漏或与CRT堆无关的任何其他类型的内存泄漏.简单来说,VLD仅检测由于调用导致的内存泄漏.(VLD does not detect COM leaks, out-of-process resource leaks, or any other types of memory leaks that are not associated with the CRT heap. In simpler terms, VLD only detects memory leaks that are the result of calls to)
new要么(or)malloc.请记住,VLD是作为内置内存泄漏检测器的替代方法创建的,后者也仅检测来自(. Keep in mind that VLD was created as an alternative to the built-in memory leak detector, which also only detects leaks from)new和(and)malloc.(.) - VLD与Debug Help Library的6.5版不兼容((VLD is not compatible with version 6.5 of the Debug Help Library ()dbghelp.dll(dbghelp.dll)).推荐版本(). The recommended version of)*dbghelp.dll(dbghelp.dll)*与VLD一起使用的是6.3. 6.3版包含在VLD发行版中.(to use with VLD is 6.3. Version 6.3 is included in the VLD distribution.)
- VLD发行版中包含的预编译库可能与Visual Studio 2005不兼容.如果您需要在Visual Studio 2005中使用VLD,(The pre-compiled libraries included in the VLD distribution may not be compatible with Visual Studio 2005. If you need to use VLD with Visual Studio 2005,) 从源代码构建VLD(building VLD from source) 在Visual Studio 2005中应该创建兼容的库.(in Visual Studio 2005 should create compatible libraries.)
学分(Credits)
- 感谢Alexandre Nikolov迅速发现了0.9e中的错误,并帮助他们快速修复了问题.(Thanks to Alexandre Nikolov for quickly discovering the bug in 0.9e and helping to slap together a quick fix.)
- 感谢如何提高VLD的全球水平的想法(Credit for the idea of how to make VLD’s global class)
VisualLeakDetector在任何其他用户全局对象进入cmk之前先构造对象.谢谢cmk!(object get constructed before any other user global objects goes to cmk. Thanks cmk!) - 感谢Nitrogenycs(aka Matthias)发现了(Thanks to Nitrogenycs (aka Matthias) for discovering the)
VLD_MAX_DATA_DUMP无限循环错误.(infinite loop bug.) - 感谢hsvcs(aka Holger)发现了(Thanks to hsvcs (aka Holger) for discovering the)
VLD_MAX_DATA_DUMP编译错误.(compilation bug.) - 感谢Don Clugston向我指出,人们有时确实会构建优化的调试可执行文件,因此我需要提防这一点.(Thanks to Don Clugston for pointing out to me that people sometimes do build optimized debug executables, and that I need to watch out for that.)
参考文献(References)
以下是一些有用的相关文章和资源的链接:(Here are some links to useful related articles and resources:)
-
_CrtSetAllocHook从MSDN库.(from the MSDN Library.) -
StackWalk64从MSDN库.(from the MSDN Library.) - 使用符号处理程序(Using the Symbol Handler) ,来自MSDN Library.(, from the MSDN Library.)
- IA-32英特尔架构软件开发人员手册-第1卷(IA-32 Intel Architecture Software Developer’s Manual - Volume 1) .第3.5节说明了(. Section 3.5 explains the)
EIP注册以及软件如何与之交互.(register and how software can and cannot interact with it.)
执照(License)
视觉检漏仪是根据以下条款分发的(Visual Leak Detector is distributed under the terms of the) GNU较小通用公共许可证(GNU Lesser General Public License) .有关详细的许可信息,请参阅可下载的ZIP文件中包含的文档.(. See the documentation included in the downloadable ZIP files for detailed licensing information.)
历史(History)
该列表简要概述了各个发行版之间所做的更改.有关每个版本中所做更改的详细说明,请参阅更改日志,(This list gives a brief overview of the changes made from release to release. For a detailed description of changes made in each release, please see the change log,)CHANGES.txt(CHANGES.txt),位于可下载的ZIP文件中.(, in the downloadable ZIP files.)
- **2006年11月14日:(14 November 2006:)**1.9d beta版-修复了多线程程序中可能发生的死锁错误.还修复了两个失败的断言错误.(Version 1.9d beta - Fixed a deadlock bug that may occur in multithreaded programs. Also fixed two failed assertion bugs.)
- **2006年11月6日:(6 November 2006:)**1.9c beta版-新安装程序使从VLD入门更加容易.与Visual Studio 2005的所有已知不兼容性已得到修复.(Version 1.9c beta - New installer to make starting out with VLD easier. All known incompatibilities with Visual Studio 2005 have been fixed.)
- **2006年3月9日:(9 March 2006:)**1.9a beta版-全新的泄漏检测引擎可以检测大多数(如果不是全部)进程内存泄漏,而不仅仅是检测来自(Version 1.9a beta - Entirely new leak detection engine detects most, if not all, in-process memory leaks not just leaks from)
new要么(or)malloc.还添加了许多其他新的便利功能.(. Added many other new convenience features as well.) - **2005年8月5日:(5 August 2005:)**1.0版-添加了几个新功能,并修复了一些错误.本文已进行了重大修订,以使其相对于1.0版保持最新.(Version 1.0 - A couple of new features have been added, and a few bugs have been fixed. Major revisions have been made to this article to bring it up to date with respect to the 1.0 release.)
- **2005年5月2日:(2 May 2005:)**0.9i beta版-此版本修复了一些错误.它还包括对Windows x64的支持.(Version 0.9i beta - This release fixed several bugs. It also includes support for Windows x64.)
- **2005年4月22日:(22 April 2005:)**0.9h beta版-此版本包含0.9g版本中的内部逻辑错误的重要修复程序.(Version 0.9h beta - This release contains a crucial fix for an internal logic bug in version 0.9g.)
- **2005年4月22日:(22 April 2005:)**0.9g beta版-此版本包含大大改进的内部搜索/排序算法,可显着提高整体性能.(Version 0.9g beta - This release contains a vastly improved internal search/sort algorithm that results in a significant overall performance boost.)
- **2005年4月13日:(13 April 2005:)**0.9f beta版-这可以快速修复0.9e中可能导致崩溃的错误.(Version 0.9f beta - This provides a quick fix for a bug in 0.9e that can cause crashes.)
- **2005年4月12日:(12 April 2005:)**0.9e beta版-通过消除对STL组件的使用来解决预构建库与Visual Studio .NET之间的兼容性问题(预构建库是在Visual Studio 6.0中构建的,并且STL在.NET和6.0之间不兼容) .(Version 0.9e beta - Solves compatibility problems between the pre-built libraries and Visual Studio .NET by removing the use of STL components (the pre-built libraries are built in Visual Studio 6.0 and the STL is not compatible between .NET and 6.0).)
- **2005年3月30日:(30 March 2005:)**0.9d beta版-VLD作为一组预构建库的第一个发行版.(Version 0.9d beta - First release of VLD as a set of pre-built libraries.)
- **2005年3月17日:(17 March 2005:)**0.9c beta版-修复了以下编译错误(Version 0.9c beta - Fixed a compilation error if)
VLD_MAX_DATA_DUMP被定义为.(is defined.) - **2005年3月15日:(15 March 2005:)**0.9b beta版-增强了检测全局C ++对象构造函数中泄漏的功能.(Version 0.9b beta - Improved ability to detect leaks in global C++ object constructors.)
- **2005年3月12日:(12 March 2005:)**0.9a beta版-首次公开发行.(Version 0.9a beta - Initial public release.)
许可
本文以及所有相关的源代码和文件均已获得The Code Project Open License (CPOL)的许可。
VC7.0 VC7.1 VC6 .NET1.1 Win2K .NET1.0 Visual-Studio MFC VS.NET2003 Dev 新闻 翻译